DISGENET offers several scoring metrics to help you evaluate and prioritize gene–disease and variant–disease associations. This article explains each score, what it measures, and when to use it.
The GDA Score and VDA Score
The GDA Score (Gene–Disease Association) and VDA Score (Variant–Disease Association) are the primary evidence metrics in DISGENET. Both are composite metrics summarizing the amount and type of evidence for an association, taking into account the number of sources, their curation level, publication count, and evidence type.
Note: The score was originally capped at 1. The cap has been removed, so associations with exceptionally strong support may now exceed 1 (GDA scores up to ~1.55, VDA scores up to ~1.3). If you need scores on a strict 0–1 scale for comparison purposes, use the Normalized Score instead.
Each score is calculated as a weighted sum of evidence components:
GDA Score components: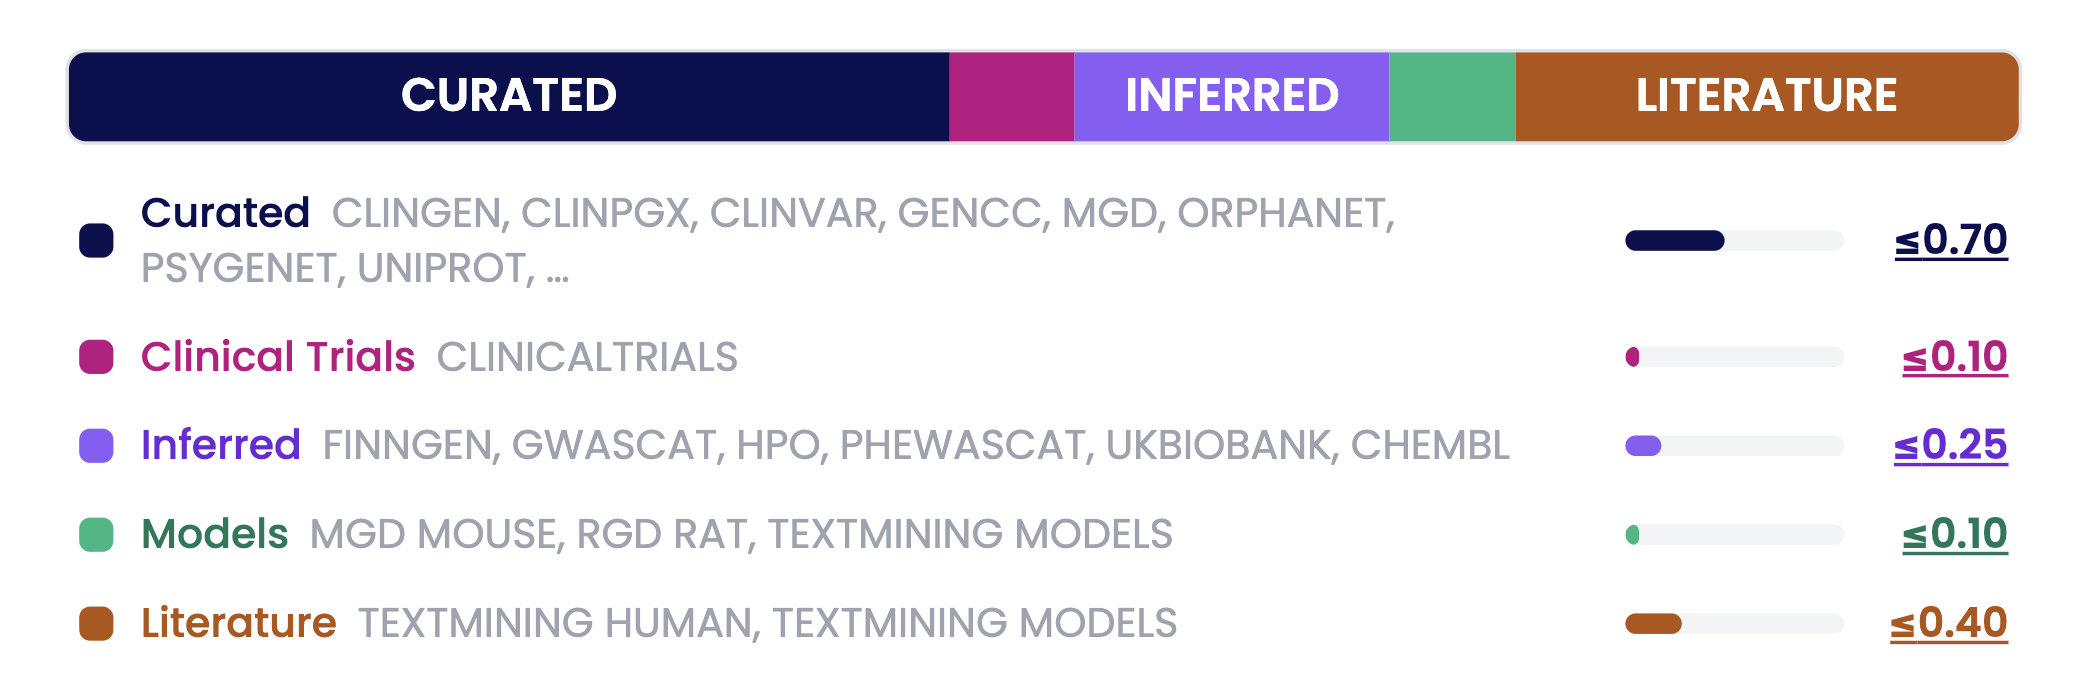
Values (≤ x.xx) represent the maximum contribution each component can make.
Curated — Expert-reviewed databases (ClinGen, ClinVar, UniProt, Orphanet, and others) — max contribution: 0.70
Clinical Trials — Evidence from ClinicalTrials.gov — max contribution: 0.10
Inferred — GDAs inferred from large-scale genetic analyses, phenotype mapping, and other sources analyses (GWAS, PheWAS, HPO, ChEMBL) — max contribution: 0.25
Models — Animal model evidence (mouse, rat) — max contribution: 0.10
Literature — Number of PubMed publications — max contribution: 0.40
VDA Score components:
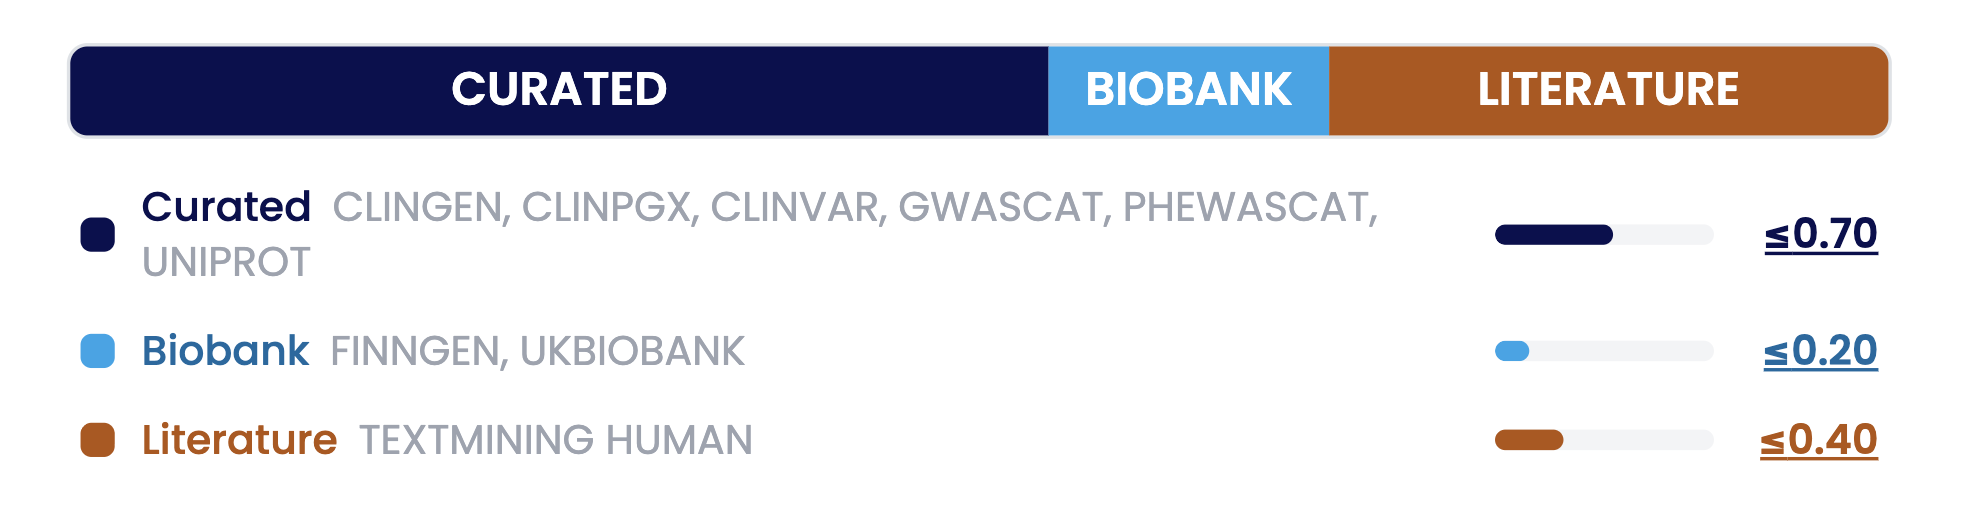
Values (≤ x.xx) represent the maximum contribution each component can make.
Curated — Expert-reviewed variant databases — max contribution: 0.70
Biobank — Population-scale genetic studies (FinnGen, UK Biobank) — max contribution: 0.20
Literature — Number of PubMed publications — max contribution: 0.40
How to interpret the scores
Use high scores to find well-established associations. Use low scores (0.1–0.2) to identify emerging findings.
Where to find it: The GDA/VDA Score appears in the Summary Table after running a query. If the column is not visible, click Select Columns and enable ScoreGDA or ScoreVDA.
The GDA/VDA Score is available in the web interface, the REST API, and the R package.
For more details, see the documentation page.
The Normalized Score
The Normalized Score is a min-max normalized version of the GDA and VDA Scores. It rescales all association scores to a standard 0–1 range while preserving their relative ordering and proportional differences, improving comparability across the full dataset.
The key difference from the original DISGENET Score: the original score reflects absolute evidence level; the normalized score reflects relative position within the dataset. Use the Normalized Score when comparing associations across different diseases or genes where absolute score differences may be misleading, or when you need a guaranteed 0–1 range for analysis.
For example:
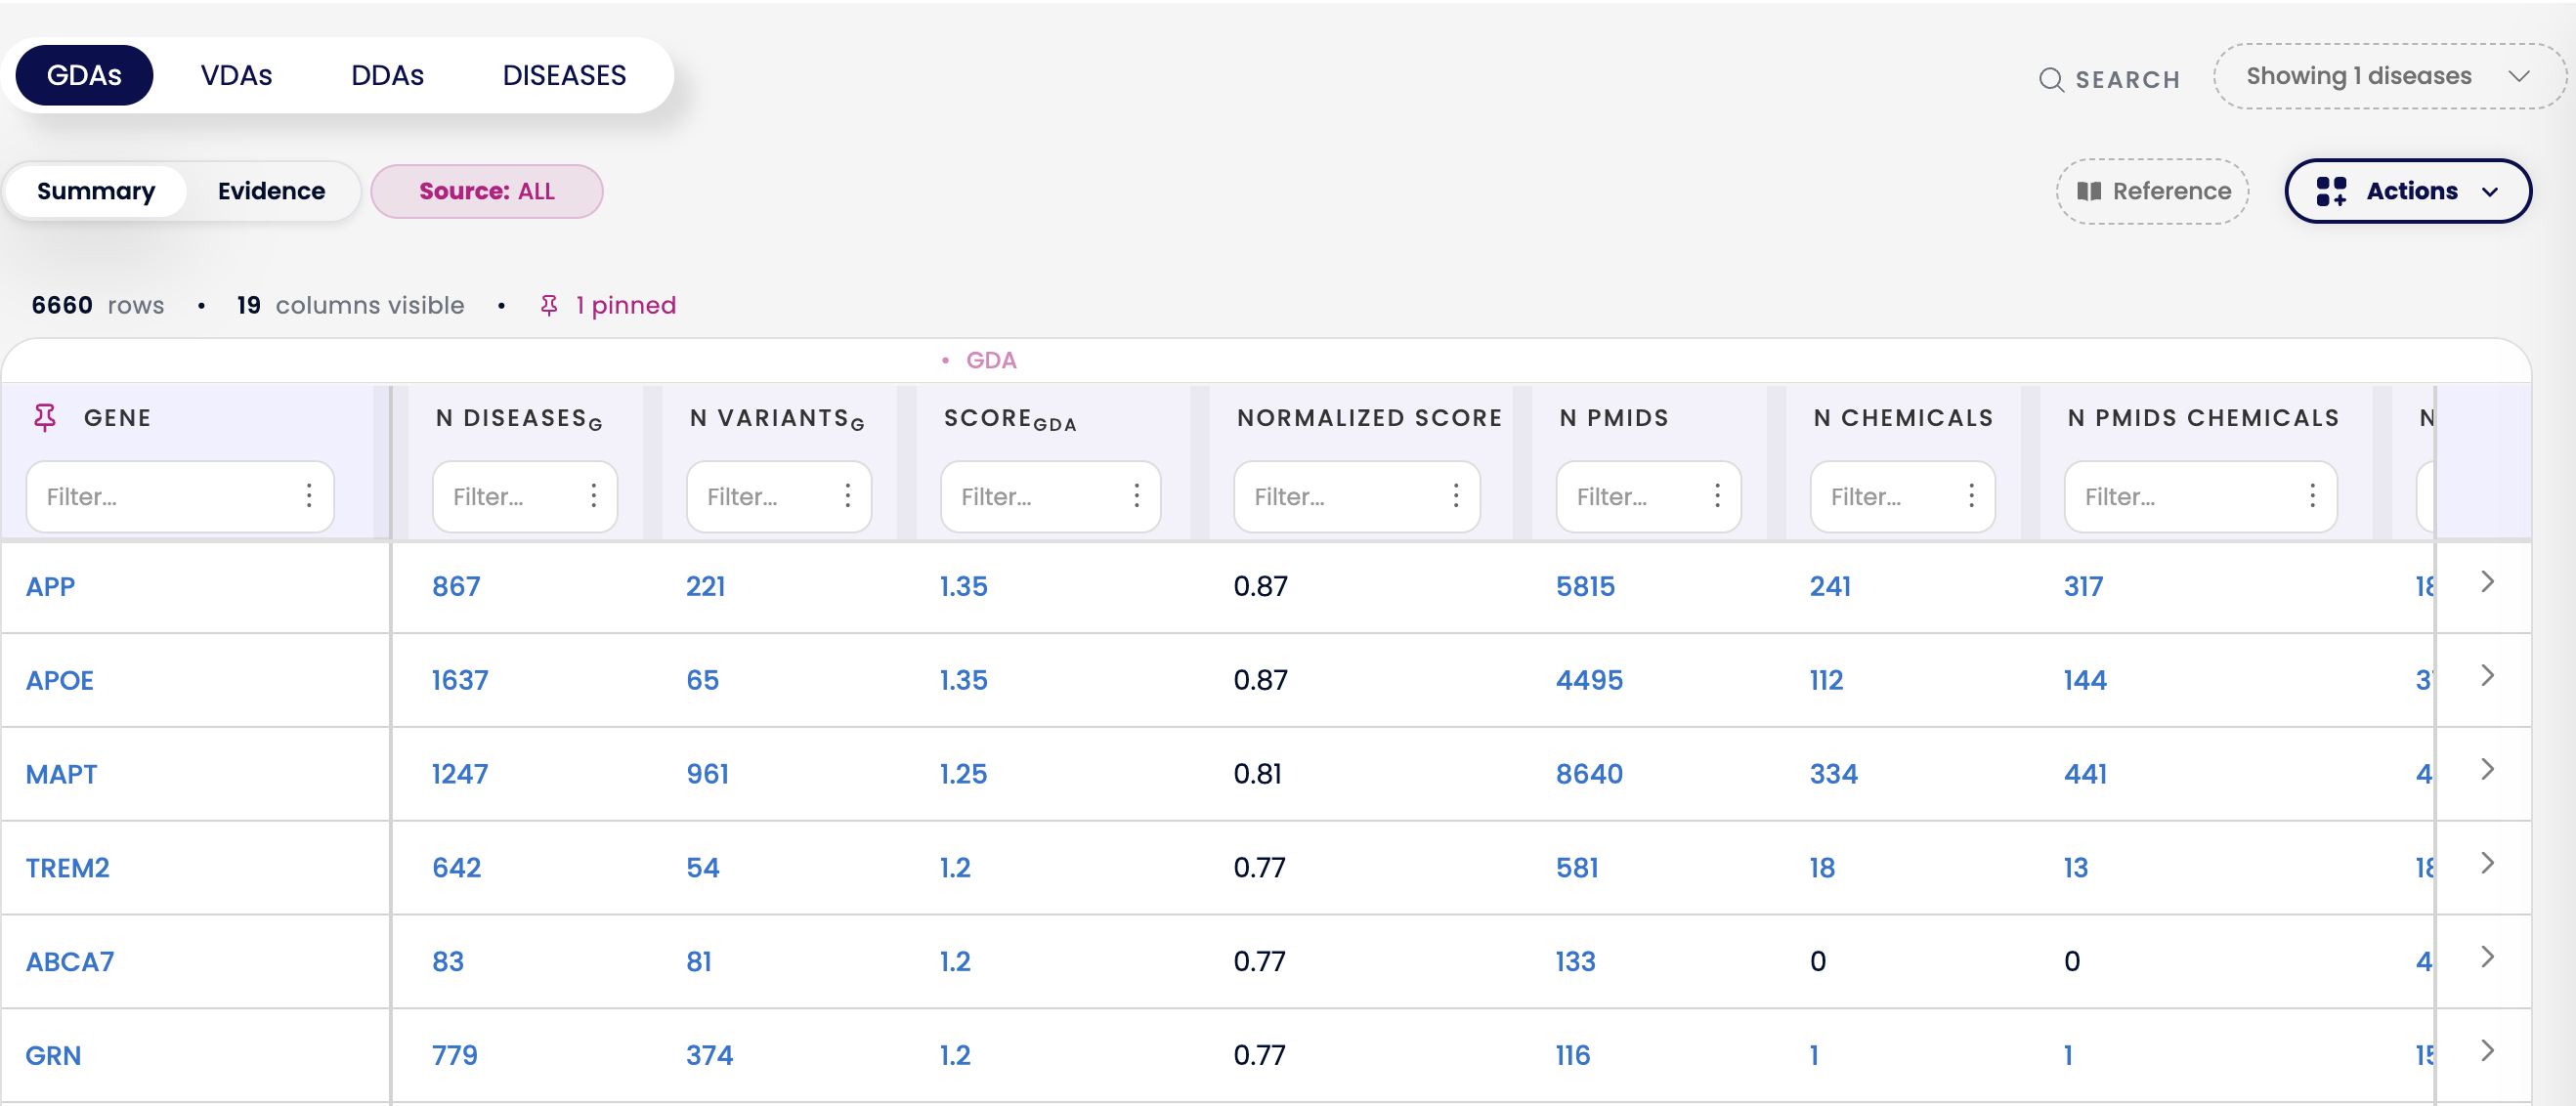
When searching Alzheimer's Disease, genes like APP, APOE, MAPT, TREM2, and ABCA7 would previously all appear with a GDA Score of 1.0 due to the old cap — making it difficult to distinguish which had stronger evidence. Today, their true scores range from 1.20 to 1.35, and the Normalized Score translates these to values between 0.77 and 0.87, making their relative ranking immediately clear.
The Normalized Score is available in the web interface, the REST API, the R package, and the Cytoscape App.
My Score
My Score is a fully customizable scoring metric for GDA and VDA associations. You select the evidence sources that matter most for your use case and assign your own weights — DISGENET then filters the data according to the sources selected and computes a weighted score to rank the associations accordingly.
What you can do with My Score:
Choose any combination of sources (e.g., GenCC, UniProt, ClinicalTrials, GWAS Catalog)
Assign custom weights ensuring they add up to 1
Save your configuration and reapply it for future searches
Apply your own prioritization method to DISGENET data
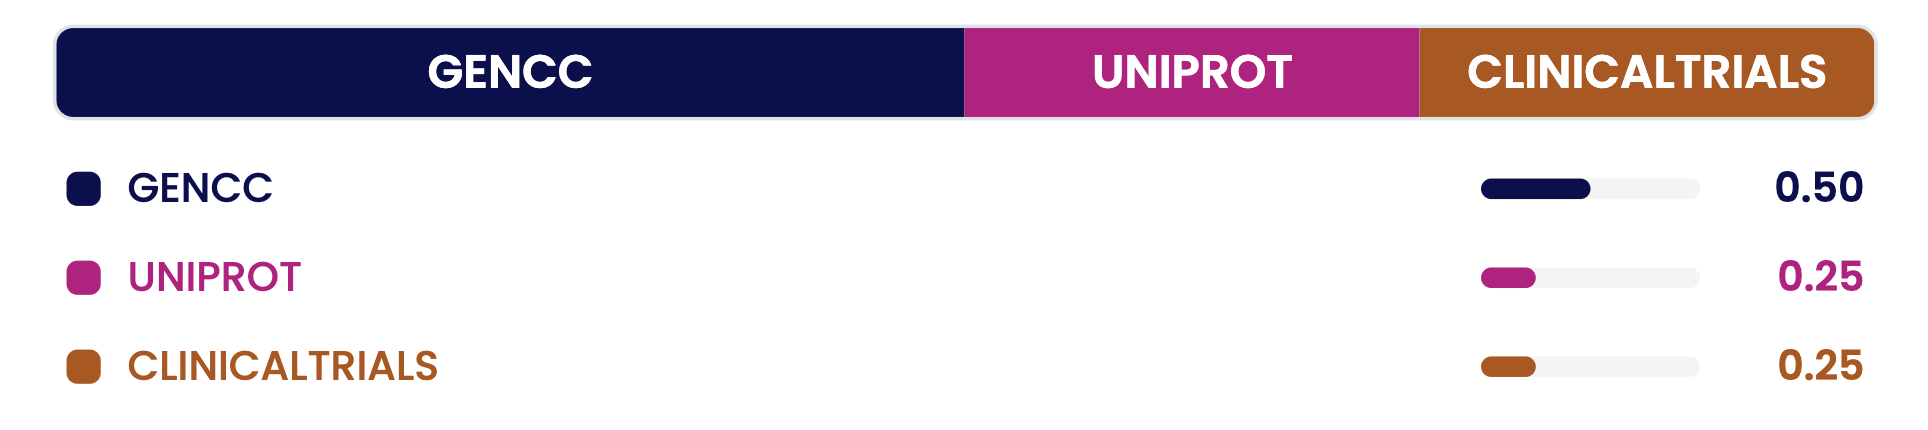
Example with equal distribution. Weights are user-defined and must sum to 1.
My Score is available through the web interface only and can be saved to your Favorites for reuse.
The Historical Score
The Historical Score recalculates the GDA Score using only evidence available within a selected year or range of years. By using the Historical Score, you can apply a temporal filter across all data sources.
How it works:
For selected databases (e.g, ClinVar, GenCC, and ClinGen), record-level timestamps are used to determine when evidence became available.
For all sources, supporting publication dates are also used to estimate evidence availability.
The evidence availability date is defined as the earliest available date, based on either a record-level timestamp or a supporting publication.
Literature counts, and the final weighted score components are dynamically recomputed using only the evidence available during the selected time period.
When to use it: To assess how evidence for an association has evolved over time, or to reproduce scoring as it would have appeared in a specific year.
The Historical Score is available through the web interface, via a dedicated REST API endpoint, and as a new function in the R package.
For a video demonstration of the Historical Score, see the v26.2 release blog.
Quick Comparison
Was this article helpful?
That’s Great!
Thank you for your feedback
Sorry! We couldn't be helpful
Thank you for your feedback
Feedback sent
We appreciate your effort and will try to fix the article